Multimedia and Human Computer Interaction Final Project

User Documentation

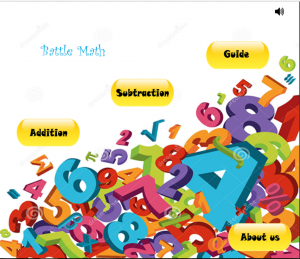
This is the Start menu of the game. There are the modes of the game, guide, and about us.

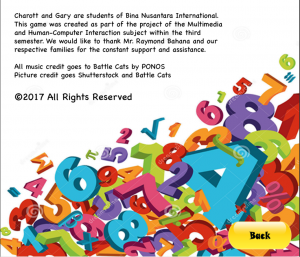
In the About us there are data about the creators and the credits of the game.

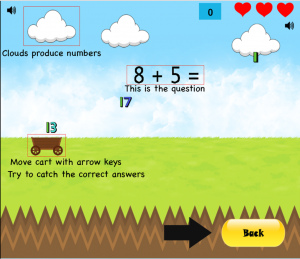
The guide screen contains some simple explanation about the game.

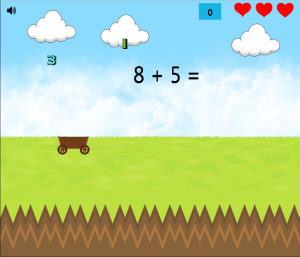
This is the game interface. Users must catch the numbers according to the question. If it is right, the program will add the score, but, if it is wrong, the program will reduce the remaining life.

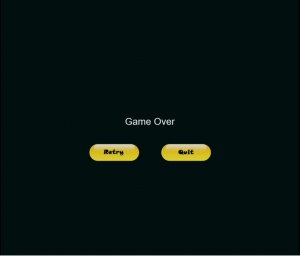
When the user doesn’t have any remaining life, the game over screen will pop out and the user can choose between retry or quit the game.

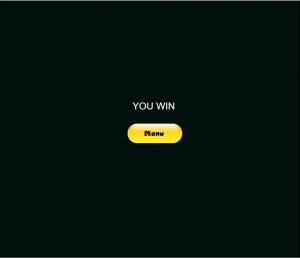
If the the user can reach the score to 100, The win screen will pop out and user can go back to the menu.


I was in charged in creating the mechanic of the games, buttons, and finding the music for the game.


Multimedia and Human Computer Interaction Final Project Proposal

Project’s Introduction

This game is made for children to train their math skill and accuracy. There are two modes in the game. The first one is addition and the second one is subtraction. The concept of the game is simple, there will be a question at the start of the game and numbers will fall from the cloud. The children must move the cart using arrow keys to catch the number. if the children catch the correct number, the question will be changed and the program will add a score depending on the answer they catch, but, If the children catch the wrong number, the question will be changed and the program will reduce the remaining life. In order to win the game the children need to obtain 100 points.

Database Final Project

Day 1

On day 1, I and my teammates work together to create the ER diagram for the final project. At first my teammates came up with a solution for the ER diagram. But, at some point I noticed that something is missing. So, I created my own ER diagram and show it to my teammates. My ER diagram solve the problem that the first diagram have and because of that I and my teammates decided to use the ER diagram that I created.


Day 2

On day 2, I try to make the table and the attributes for the table. According to the diagram I should make 8 tables, and those tables are staff, office, taxiowner, car, driver, manager, clients, and jobs.

Day 3

On day 3, I made the query question from A to Z and implemented it on a program using Visual Basic. some of the query were tricky but I managed to do the query and answer all the question.


Day 4

On the last day, I and my teammates discussed about the things that should be improved and after that I add a little features on the program.